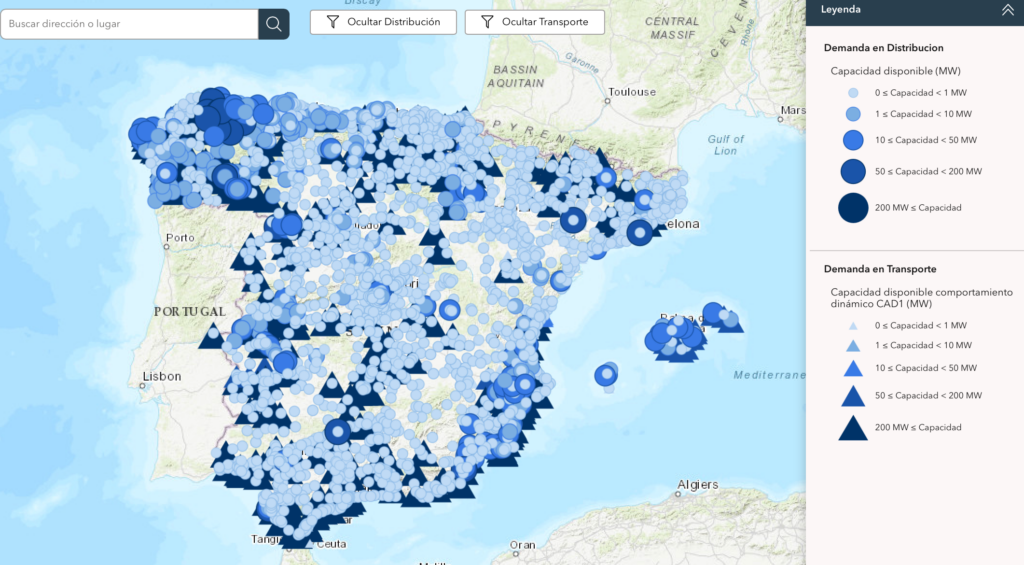
Se trata de dos mapas interactivos con la capacidad disponible en las redes eléctricas de España, uno orientado a generación y otro a demanda. Los mapas permiten consultar la capacidad de acceso mediante distintos filtros y la información se actualizará mensualmente.
Why it matters: Stop wasting engineering hours on grid-constrained sites; use the new CNMC maps to qualify your pipeline in seconds, not months.
Stop Guessing, Start Closing
For years, developers in Spain have operated in a regulatory fog, spending thousands on feasibility studies only to be stonewalled by a 'no capacity' notice from REE. The CNMC’s promise to publish monthly interactive maps for both generation and demand isn't just bureaucratic housekeeping; it’s the most significant piece of market intelligence to hit the Iberian Peninsula since the repeal of the Sun Tax.
The C&I Sweet Spot
This is a tactical goldmine for the C&I segment. If you are pitching a 500kW rooftop array in Castilla-La Mancha, the biggest risk to your IRR isn't the hardware—it's the grid connection bottleneck. By overlaying demand capacity, you can now pivot your sales strategy to target industrial zones where the grid is actually crying out for local injection. Forget the 'spray and pray' prospecting method. If the map shows a node with high demand capacity, you can guarantee a faster PPA approval process for your client.
The Reality CheckThe days of 'black box' grid planning are coming to a close. If you aren't using this data to filter your pipeline, your competitors in Madrid and Barcelona will be. Stop wasting your engineering team’s time on projects that are dead on arrival and start chasing the nodes that are actually open for business.